Development Tools
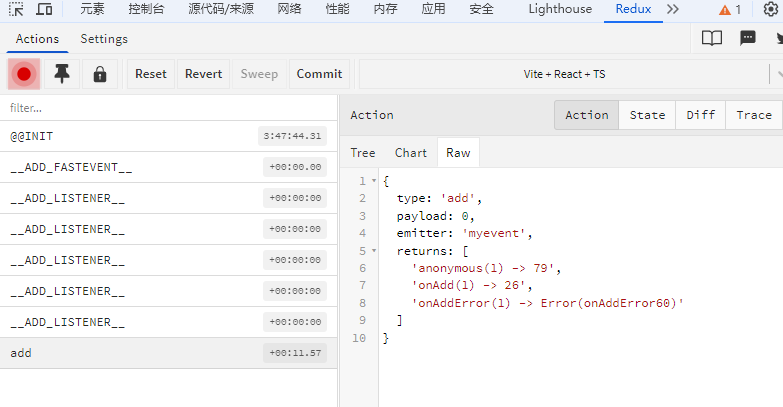
FastEvent provides debugging tools that allow you to inspect triggered events, listener counts, and other information in Redux DevTools.
Installation and Usage Steps
Step 1: Install Redux DevTools
For
Chromebrowser:- Visit Chrome Web Store
- Click "Add to Chrome" to install the extension
For
Firefoxbrowser:- Visit Firefox Add-ons
- Click "Add to Firefox" to install the extension
Step 2: Use in Code
Import fastevent/devtools in your application entry file and enable debug=true.
javascript
import 'fastevent/devtools';
import { FastEvent } from 'fastevent';

const emitter = new FastEvent({
    debug: true,
});
Step 3: View Debug Information
- Open your application page
- Press
F12to open browser developer tools - Find the
Reduxtab (if not visible, click>>to expand more tabs) - In
Redux DevToolsyou can see:- Event trigger records
- Event payload and meta data
- Subscriptions and unsubscriptions
- Number of retained messages
- Listener return values and call counts
Every time an event is triggered, you can see detailed state change information in Redux DevTools, which is very helpful for debugging and understanding the event flow in your application.